
At its core, measuring marketing ROI comes down to a simple formula: (Revenue Generated – Marketing Cost) / Marketing Cost x 100.
This gives you a straight-up percentage, showing exactly how much you got back for every dollar you put in. Simple, right? But the real work is in finding those numbers and telling the story behind them.
Why Proving Marketing ROI Is No Longer Optional

Let's be honest. The days of getting marketing budgets approved on a vibe are long gone. The C-suite isn't just asking what you did anymore; they're demanding to know what it was worth.
Knowing how to measure and prove marketing ROI has become a survival skill. It's not just another report to fill out.
For too long, marketing has been seen as a cost center—a necessary expense with fuzzy outcomes. But when you get your measurement right, you can flip that script and reposition your team as a predictable revenue engine. This guide is your playbook for doing exactly that.
The New Reality for Marketers
The pressure to justify every dollar is real and it's not going away. Proving ROI is now the top priority for a whopping 83% of marketing leaders. This isn't just talk; 64% of companies now base future marketing budgets directly on past performance.
They're doubling down on what works and cutting what doesn't. You can dig into more of this data by reading up on the latest marketing ROI statistics.
But in B2B, it's never as simple as plugging numbers into a formula. We're dealing with a different beast altogether:
- Long Sales Cycles: Deals can take 6-12 months (or longer) to close. How do you connect a blog post read in January to a signed contract in December?
- Multiple Touchpoints: A single customer might read a few articles, see a LinkedIn ad, attend a webinar, and exchange a dozen emails before they ever talk to sales.
- Buying Committees: You're not selling to one person. You're selling to a group of stakeholders, each with their own priorities and ways of engaging with your content.
The real challenge isn't just calculating a number; it's telling a credible story with that number. Your ROI report needs to connect the dots between your team's day-to-day grind and the company's bottom-line growth.
Core B2B Marketing ROI Metrics at a Glance
Before we dive deep, here are the foundational metrics and their formulas. Mastering these is the first step toward accurate ROI calculation.
| Metric | Formula | What It Tells You |
|---|---|---|
| Marketing ROI | ((Revenue - Marketing Cost) / Marketing Cost) x 100 |
The overall profitability of your marketing efforts. |
| Customer Lifetime Value (LTV) | Average Purchase Value x Purchase Frequency x Customer Lifespan |
The total revenue you can expect from a single customer account. |
| Customer Acquisition Cost (CAC) | Total Sales & Marketing Cost / Number of New Customers |
How much it costs to acquire a new paying customer. |
| LTV:CAC Ratio | LTV / CAC |
The value of a customer in relation to the cost of acquiring them. A healthy ratio is often considered 3:1 or higher. |
These are your building blocks. Nail these, and you're already ahead of the game.
From Cost Center to Revenue Engine
Getting a handle on ROI does more than just protect your budget. It builds unshakable credibility with your leadership team.
When you can confidently answer, "What did we get for our marketing spend?" with hard numbers, you fundamentally change the conversation. You stop defending costs and start highlighting contributions.
This is how you secure bigger budgets for the campaigns that are actually working. It's how you get the green light to experiment with new channels. Most importantly, it's how you earn a strategic seat at the table where the big decisions are made.
Building Your Measurement Foundation

You can't prove your worth with fuzzy numbers. Calculating an accurate ROI isn't magic—it all comes down to having solid data plumbing.
Before you can stand in front of your boss and confidently report on your return, you have to know that the information flowing through your systems is clean, connected, and actually telling the real story. This is the foundation that separates guessing from knowing.
A lot of marketing teams get stuck chasing vanity metrics like impressions or follower counts. But the C-suite doesn't care about how many people saw your ad. They want to know how many people bought something.
Focus on What Actually Makes Money
If you want leadership to trust your numbers, you have to speak their language. That means shifting your entire focus from top-of-funnel activity to bottom-line results. Your dashboard shouldn't be a celebration of being busy; it should be a direct reflection of business impact.
These are the metrics your entire system needs to be built around. No exceptions.
- Customer Acquisition Cost (CAC): How much, in total, does it cost you in sales and marketing to land one new customer? This is your efficiency score.
- Customer Lifetime Value (LTV): What’s the total revenue you can expect from a single customer over their entire time with you?
- Lead-to-Customer Conversion Rate: Of all the leads marketing brings in, how many actually sign a contract? This one percentage tells you a ton about your pipeline's health.
- Sales Cycle Length: How long does it take to turn a fresh lead into a closed deal? Marketing's job is to shrink this number.
Nailing these down gives you the ammo for the most important calculation of all: the LTV to CAC ratio. A healthy B2B company is usually looking for a ratio of 3:1 or better. In plain English, a customer should be worth at least three times what you paid to get them.
Create a Single Source of Truth
The single biggest killer of accurate ROI tracking? Fragmented data.
Your website analytics are in one place. Your customer data is in another. Your campaign info is scattered across a dozen different platforms. It's impossible to see the whole picture when your data lives in separate silos.
The fix is to create one single source of truth, and your Customer Relationship Management (CRM) platform is the perfect place for it. Think Salesforce or HubSpot. This becomes your central command.
Then, you connect everything to it, starting with your main analytics tool, like Google Analytics 4 (GA4). This integration is critical because it lets you push real sales data from your CRM back into GA4. Suddenly, you can see which traffic sources, ads, and content—like the stuff in a solid content marketing for B2B companies strategy—are generating revenue, not just clicks.
Without this integration, you're flying blind. You might know a blog post got you 50 leads, but you’ll have no idea if any of them turned into six-figure deals or churned after a month.
The Unsung Hero of ROI Tracking: UTMs
Once your systems are talking, you need a way to stamp and track every single person who comes from your marketing efforts. This is what UTM parameters were born to do.
These little tags you add to the end of your URLs are the absolute bedrock of good campaign tracking. Using them consistently is non-negotiable if you're serious about measuring marketing ROI. They give every dollar you spend a name tag, letting you follow its path from a click on a LinkedIn ad all the way to a "closed-won" deal in your CRM.
A Practical UTM Naming Convention
Let's say you're running a LinkedIn ad for a new ebook. Here’s what your UTMs should look like:
| Parameter | Value | Description |
|---|---|---|
| utm_source | linkedin |
Tells you the traffic came from LinkedIn. |
| utm_medium | cpc |
Specifies it was a paid ad (cost-per-click). |
| utm_campaign | ebook-q2-launch |
Names the specific campaign you're running. |
| utm_content | ceo-quote-ad |
Differentiates between ad versions. |
| utm_term | saas-founders |
Notes the specific audience you targeted. |
You have to create a strict, documented naming system that your entire team follows religiously. Otherwise, you'll end up with a mess of inconsistent data that makes your reports worthless. This discipline is the final piece of the puzzle, building a foundation that can actually deliver the insights you need to prove your marketing works.
Choosing the Right Marketing Attribution Model
Figuring out what actually made someone buy is a messy business. Especially in B2B.
The sales cycle can drag on for months, involving dozens of touchpoints—a blog post here, a webinar there, maybe a LinkedIn ad that finally got them to book a demo. An attribution model is just the set of rules you use to give credit where credit is due.
Picking the right one is absolutely critical for calculating an accurate ROI. It’s the difference between confidently doubling down on a winning channel and throwing money into a fire pit.
This isn’t just a nice-to-have anymore. The whole market for measuring ad effectiveness and ROI is set to explode, jumping from $4.6 billion in 2025 to a massive $16.4 billion by 2034. Why? Because brands are finally getting serious about tracking the entire customer journey. You can dig into these market trends in ROI measurement to see why multi-touchpoint tracking is becoming the standard.
Get this wrong, and you might accidentally kill a top-of-funnel channel that’s quietly feeding you all your best leads, all while over-investing in the channel that just happens to be the last click.
The Simple (But Dangerous) Single-Touch Models
The easiest way out is to give all the credit to one single interaction. These models are a breeze to set up, but they often give you a dangerously skewed view of reality.
There are two usual suspects:
- First-Touch Attribution: This one gives 100% of the credit to the very first thing a prospect ever did. They found you through an old blog post? Boom, the blog gets all the glory. It doesn't matter if they later attended three webinars and got a personal demo. It’s great for spotting what's good at generating initial awareness, but that's about it.
- Last-Touch Attribution: The polar opposite. This model gives 100% of the credit to the final touchpoint before they converted. They clicked a Google Ad and then bought? The ad gets the trophy. This tells you what closes deals, but it completely ignores how those deals were created in the first place.
The glaring problem here is that both models ignore everything that happens in the middle. It’s like watching the first and last five minutes of a movie and trying to write a review. You’re missing the entire plot.
Multi-Touch Models: Getting Closer to the Truth
Multi-touch attribution models are built on a simple premise: a sale is the result of many interactions, not just one. So, they spread the credit across multiple touchpoints.
Yes, they require better tracking. But the payoff is a far more realistic picture of how your marketing is actually working together. You stop looking at isolated events and start seeing the entire journey.
Moving to a multi-touch model means you're committing to understanding the full story of how a customer finds you. You stop asking, "What was the one thing that made them convert?" and start asking, "What combination of efforts guided their decision?"
Let's break down the most common ones.
- Linear Attribution: The "everyone gets a trophy" model. It splits the credit evenly across every single touchpoint. Four interactions? Each gets 25%. It’s fair, but it assumes every touchpoint had an equal impact, which is rarely true.
- Time-Decay Attribution: This model is all about momentum. It gives more credit to touchpoints that happened closer to the sale. A click from yesterday is worth more than a blog view from six months ago. This is pretty useful for businesses with shorter, faster sales cycles.
- U-Shaped (Position-Based) Attribution: This is often a B2B favorite. It gives the most weight to two key moments: the first touch (the spark of awareness) and the lead-conversion touch (the moment they officially became a lead). A common setup is giving 40% of the credit to the first touch, 40% to the lead conversion, and splitting the remaining 20% among all the interactions in between.
Choosing the right model really depends on your business and sales cycle. To make it a bit clearer, here’s a quick rundown of your main options.
Comparing Common Marketing Attribution Models
Deciding which model to use isn't just a technical choice; it's a strategic one that shapes your entire marketing budget. This table breaks down the most common models to help you see which one aligns best with your goals and the complexity of your customer journey.
| Attribution Model | How It Works | Best For | Potential Drawback |
|---|---|---|---|
| First-Touch | 100% credit to the first interaction. | Understanding top-of-funnel channels that generate initial awareness. | Ignores everything that happens after the first touch. |
| Last-Touch | 100% credit to the final interaction before conversion. | Identifying bottom-of-funnel channels that are effective at closing deals. | Devalues the nurturing and awareness-building that got the lead there. |
| Linear | Credit is split equally among all touchpoints. | Simple multi-touch view when you believe all interactions are equally important. | Doesn't differentiate the impact of a blog read vs. a demo request. |
| U-Shaped | 40% credit to first touch, 40% to lead conversion, 20% to middle touches. | B2B with a distinct lead generation step; values both opening and closing. | Can undervalue crucial mid-funnel nurturing activities. |
| Time-Decay | Credit increases for touchpoints closer to the conversion time. | Shorter sales cycles where recent interactions have more influence. | Can undervalue early awareness-building that happens months before. |
Ultimately, no model is perfect. The goal is to choose the one that gives you the most accurate, actionable picture of what’s really driving revenue. For most B2B companies, that means moving beyond the simplicity of single-touch.
A Quick B2B SaaS Scenario
Let's make this real. Imagine a new customer signs a $10,000 deal with your SaaS company. Their journey looked like this:
- Touch 1: Read a blog post on industry trends (found via organic search).
- Touch 2: Attended a live webinar a month later.
- Touch 3: Clicked one of your targeted LinkedIn ads.
- Touch 4: Requested a demo directly from your pricing page.
Here’s how different models would carve up that $10,000 in revenue credit:
Look at that difference. Your choice of model completely changes which channels look like heroes and which look like zeros.
First-Touch says your blog is everything. Last-Touch gives all the credit to your website's demo page. But a model like U-Shaped gives a much more balanced story, rightfully crediting the blog for starting the conversation and the demo request for sealing the deal, without ignoring the important steps in between.
Calculating ROI for Specific Campaigns and Channels
Alright, you’ve got your data foundation and you’ve picked an attribution model. Now it’s time to get your hands dirty. This is where we stop talking theory and start applying real ROI calculations to the marketing your team is running every single day.
Knowing your overall marketing ROI is great for the boardroom, but the real magic happens when you zoom in. We’re talking about channel-level and campaign-level ROI. This is how you discover your quiet workhorses—like finding out your content marketing is secretly driving massive value or that one particular webinar series is outperforming everything else.
Drilling Down into Channel-Level ROI
To really understand what’s working, you have to isolate the return from each channel. Think SEO, paid search, or social media. This is how you make smarter budget decisions, moving money from the laggards to the performers.
Let's walk through a common B2B example: figuring out the ROI of your content marketing over a single quarter.
First, you need to tally up your total investment. And I mean everything. This isn't just about paying a few freelancers. A true cost analysis includes:
- Team Salaries: Prorated salaries for your content marketers, SEO specialists, and designers. Anyone who touched the content.
- Tool Subscriptions: What you're paying for Ahrefs or Semrush, project management tools, and analytics platforms.
- Freelance and Agency Costs: Any cash spent on outside writers, designers, or video producers.
- Promotion Budget: The ad spend you used to get eyes on your content, like boosting posts.
Once you have a total cost, it's time to attribute the revenue. Using your chosen attribution model, you’ll pull a report from your CRM of all the "closed-won" deals where content was a key touchpoint. Add up the contract value of those deals, and you’ve got your revenue.
A quick note on content: it often plays the long game. It’s critical to track both directly sourced and influenced revenue. A blog post might not be the last touch before a demo request, but it could be the very first. That makes it an essential part of your pipeline.
A Practical Campaign ROI Calculation
Now, let's get even more granular and run the numbers on a single campaign. Imagine you ran a B2B webinar to generate qualified leads for a new software feature.
The Scenario:
- Campaign: "Mastering AI in Sales" Webinar
- Total Campaign Cost: $12,000
- Leads Generated: 250
- Sales Qualified Leads (SQLs): 40
- New Customers Closed: 5
- Average Contract Value: $15,000 per year
The cost breakdown here is key. That $12,000 didn't just appear out of thin air. It was a mix of:
- Ad Spend ($6,000): For promotion on LinkedIn and Google.
- Platform Fees ($500): For the webinar hosting software.
- Speaker Fees ($3,000): To bring in an industry expert.
- Team Time ($2,500): The estimated cost of your team's hours spent planning, promoting, and following up.
With five new customers at $15,000 each, the campaign brought in $75,000 in new annual recurring revenue (ARR).
Let's plug that into the standard ROI formula:
ROI = (($75,000 – $12,000) / $12,000) x 100 = 525%
A 525% ROI is a massive win. This isn't just a vanity metric; it’s a powerful story you can take straight to leadership to justify the investment and get buy-in for your next big idea. If you want to dive deeper into building out these kinds of pipelines, check out our guide on B2B demand generation strategies.
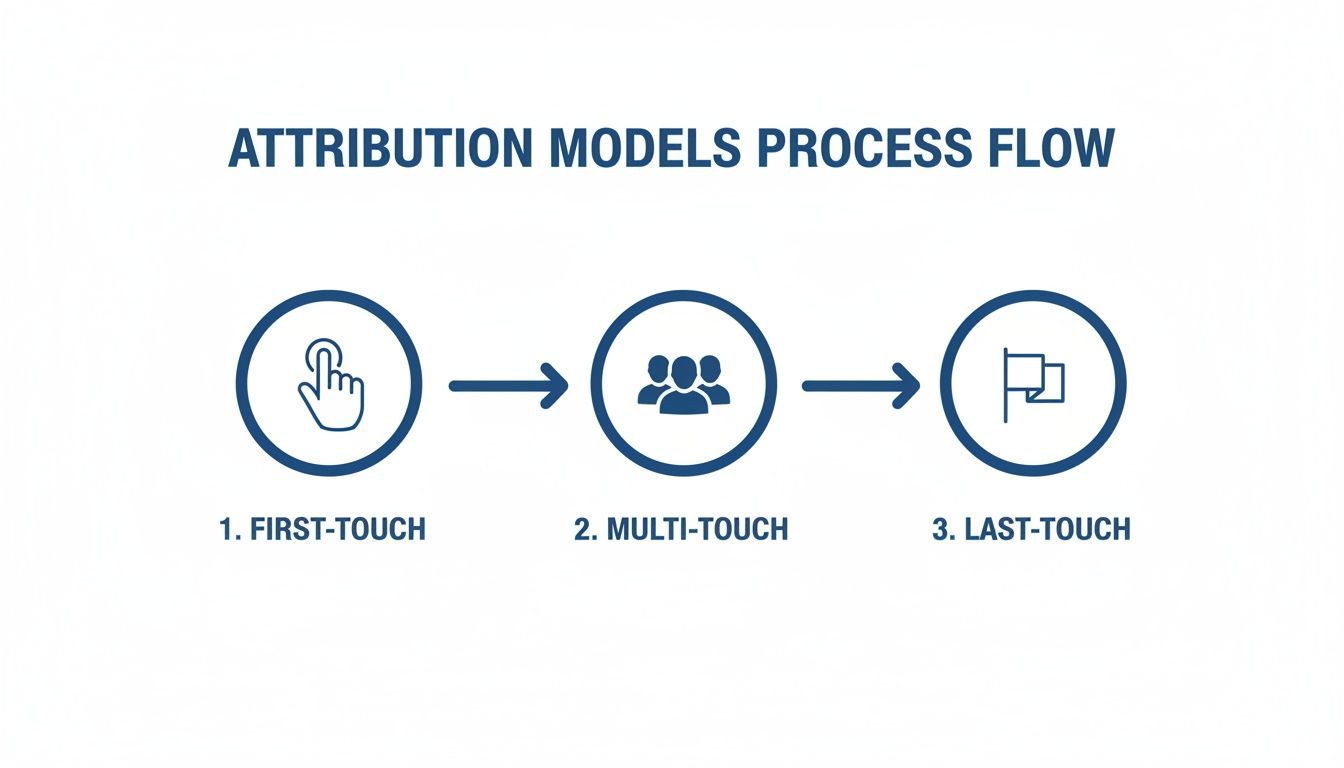
This visual breaks down how different attribution models—first-touch, multi-touch, and last-touch—assign credit. It's a great illustration of why multi-touch models usually give you a more honest picture, especially in the complex world of B2B sales where nobody buys after seeing a single ad.
Building an ROI Report That Executives Actually Read

Running the numbers on your marketing ROI is only half the job. If you can’t turn that data into a story the C-suite understands and cares about, all that hard work might as well have never happened.
Let's be honest, executives don't have time to wade through granular campaign metrics or debate attribution models. They need the big picture, and they need it fast. Your role is to connect the dots between what you spent and how the business grew, making it impossible for them to ignore.
This isn't about dumping data into a spreadsheet. It's about building a strategic narrative—a business case for your team's value and why they should give you more budget next quarter.
Know Your Audience: Two Reports, Two Goals
You can't use the same report for your internal team huddle and the quarterly board meeting. A detailed breakdown of channel performance will make a CEO’s eyes glaze over. You need two different versions.
The "So What?" Report for the Executive Team
This is your high-level dashboard. It needs to be clean, visual, and laser-focused on a few core business numbers.
- Overall Marketing ROI: The hero metric. For every dollar we put in, how many did we get back?
- Customer Acquisition Cost (CAC): How much did it cost to land each new customer this quarter? More importantly, is that number going up or down?
- LTV to CAC Ratio: This is the big one for sustainability. It shows if the customers we're acquiring are actually profitable in the long run.
- Marketing-Sourced Pipeline: In hard numbers, how much new sales pipeline did we generate?
This whole thing should fit on a single slide. Think big charts, clear labels, and short bullet points that spell out the takeaways. No jargon.
The "How Did We Do It?" Report for Your Marketing Team
Here’s where you can get into the weeds. This is the operational report your team uses to optimize campaigns and make smart tactical decisions.
- Channel-Specific ROI: How did SEO stack up against Paid Search or our LinkedIn efforts?
- Campaign Performance: Did the Q2 webinar series outperform the Q1 ebook launch? Why?
- Lead-to-Customer Conversion Rates: Which channels are sending us leads that actually close?
- Cost Per Lead (CPL) & Cost Per SQL: How efficient are we at each stage? A deep dive into the B2B marketing sales funnel is crucial here to understand the entire journey.
This is the report that guides what your team does day-to-day. It’s for optimization, not just for show.
The Elephant in the Room: Proving Brand-Building ROI
One of the toughest conversations you'll ever have is with an executive who thinks brand building is "fluffy." They see it as an expense with no direct line to revenue. Your job is to make the intangible, tangible.
You can’t apply a direct-response formula to things like building thought leadership on LinkedIn or sponsoring a podcast. It just doesn't work. Instead, you have to show how these activities influence the metrics that lead to revenue.
You don't measure the ROI of brand building with a direct sales report. You measure it by tracking the metrics that make direct sales easier, faster, and cheaper over time.
Take a service like Growlancer, where we build executives into LinkedIn thought leaders. The ROI story isn't about one post leading to one sale. It's about efficiency and influence across the entire sales process.
We track things like:
- Shorter Sales Cycles: Are leads from our executives' LinkedIn profiles closing 15% faster than cold outbound leads?
- Higher Conversion Rates: Do inbound leads from our content book meetings at a higher rate?
- Increased Organic Inbound: Are more prospects saying they found us on LinkedIn in the "How did you hear about us?" field?
- Lower CAC: As our brand footprint grows, our reliance on expensive ads should drop, bringing down our overall acquisition cost.
Framing it this way changes the conversation entirely. It's no longer, "How many sales did that post get?" Instead, it's, "How is our presence on LinkedIn making our entire sales engine more powerful?" You’re connecting top-of-funnel work to bottom-line results—telling a story of strategic investment, not just another line item expense.
Common ROI Measurement Mistakes (And How to Fix Them)
Even the best marketers trip up when measuring ROI. I've seen it happen countless times. And when you get the numbers wrong, it’s not just about making a bad call on budget—it’s about losing the trust you’ve worked so hard to build with your leadership team.
Think of this as a quick sanity check for your own reporting process. Spotting these pitfalls is the first step. Building a system that’s not just accurate, but bulletproof, is the goal.
Let's walk through the mistakes I see most often and, more importantly, how to get them fixed for good.
Forgetting to Include All Your Costs
This is the big one. It's so easy to just look at ad spend, but what about all the other "soft" costs? A real ROI calculation has to account for every single dollar, not just what's on the invoice from LinkedIn or Google.
When you ignore these costs, you're just inflating your ROI and painting a picture that isn't real. The actual cost of any campaign is always way more than the media budget alone.
The Fix: Create a simple cost checklist for every major campaign.
- Team Time: What are the prorated salaries of the people who worked on this?
- Tools & Tech: A slice of your HubSpot, SEMrush, or analytics subscriptions belongs here.
- Creative & Content: Did you hire a freelance writer? A designer? A video editor? Add it up.
- Overhead: You can even allocate a small portion of general business overhead.
This gives you the True Cost of Marketing. That's the only number that matters if you want an honest ROI figure.
Using an Attribution Model That Lies to You
Like we talked about earlier, just sticking with a basic first-touch or last-touch model in a long B2B sales cycle is a huge mistake. It massively oversimplifies how customers actually buy and can trick you into cutting budget from channels that are doing the heavy lifting in the middle of the journey.
Last-touch, for instance, will almost always make your top-of-funnel content look like a failure, even if it's what brought a future whale into your world in the first place.
Your attribution model isn't a technical setting. It's a strategic decision that tells you where to put your money. A broken model guarantees a broken strategy.
The Fix: Ditch the simple models and pick one that actually mirrors your customer's path. For most B2B companies, a U-shaped (or position-based) model is a fantastic place to start. It gives proper credit to that first touchpoint that sparked interest and the final touchpoint that sealed the deal. Test out a few and see which one tells a story that matches what you hear from your sales team.
Living with Siloed Data
Your Google Analytics is over here, your CRM is over there, and your ad platforms are on another planet entirely. Sound familiar?
When your systems don't talk, you can't see the full story. Sure, you know a campaign generated 50 leads, but you have no clue if they were high-intent SQLs or duds who just wasted your sales team's time. This disconnect makes it completely impossible to tie your marketing spend to actual, closed revenue.
The Fix: Make your CRM the single source of truth. No exceptions. Integrate it directly with your marketing automation and web analytics. This creates a closed-loop system where you can follow someone from their very first anonymous visit all the way to a "closed-won" deal. Suddenly, you have a crystal-clear line of sight from click to cash.
Common Questions About Marketing ROI
ROI can get complicated fast. Let's tackle a few of the questions I hear all the time from B2B marketers trying to get their numbers straight.
What Is a Good Marketing ROI for B2B?
Everyone wants a magic number, but the truth is, "good" varies. If you need a general benchmark, a 5:1 ratio is considered pretty solid. That means for every $1 you put into marketing, you get $5 back in revenue.
If you’re hitting 10:1 or more, you’re in the top tier. But honestly, the only benchmark that really matters is your own. The real goal is to see that LTV-to-CAC ratio climb quarter after quarter. That's the sign of a healthy, growing business.
How Long Should I Wait to Measure Campaign ROI?
This one trips up a lot of people. The answer is simple: it depends on your sales cycle.
It’s completely unrealistic to judge a B2B campaign after 30 days if your average deal takes six months to close. You have to give the campaign enough runway to match how your customers actually buy. For some, that's three months. For others selling complex, enterprise-level solutions, it could be twelve months or even longer.
I've seen too many marketers kill campaigns that were just about to bear fruit. Measuring ROI too early is one of the biggest mistakes you can make. You end up cutting off a pipeline that's quietly building, all because you got impatient.
How Do You Account for Brand Marketing in ROI?
Ah, the million-dollar question. Measuring brand marketing isn't about tying a specific blog post to a specific sale. It's about tracking the indicators that show your brand's gravity is increasing in the market.
Instead of direct revenue, look for growth in these areas:
- Branded Search Volume: Are more people typing your company name into Google? That's a great sign.
- Direct Website Traffic: An uptick here means your name is memorable. People are coming straight to you.
- Share of Voice: Are you being mentioned more than your competitors in industry conversations?
For a more advanced take, you can look at marketing mix modeling (MMM) to see how your brand spend correlates with things like faster sales cycles and better performance in your other channels.
Ready to stop guessing and start building a predictable B2B pipeline on LinkedIn? Growlancer is our system for turning your leadership team's expertise into qualified meetings and revenue you can actually measure. We handle the strategy, content, and outreach so you can focus on closing deals.
See how we turn your team into a revenue engine. Book a call with us today.