
Put simply, sales velocity is just a way of measuring how fast you're making money.
Think of it like the speedometer in your car. It tells you, in real-time, how quickly you're turning potential leads into actual cash in the bank. It’s the single most important metric for understanding the health and momentum of your entire sales process.
Understanding Your Revenue Speedometer
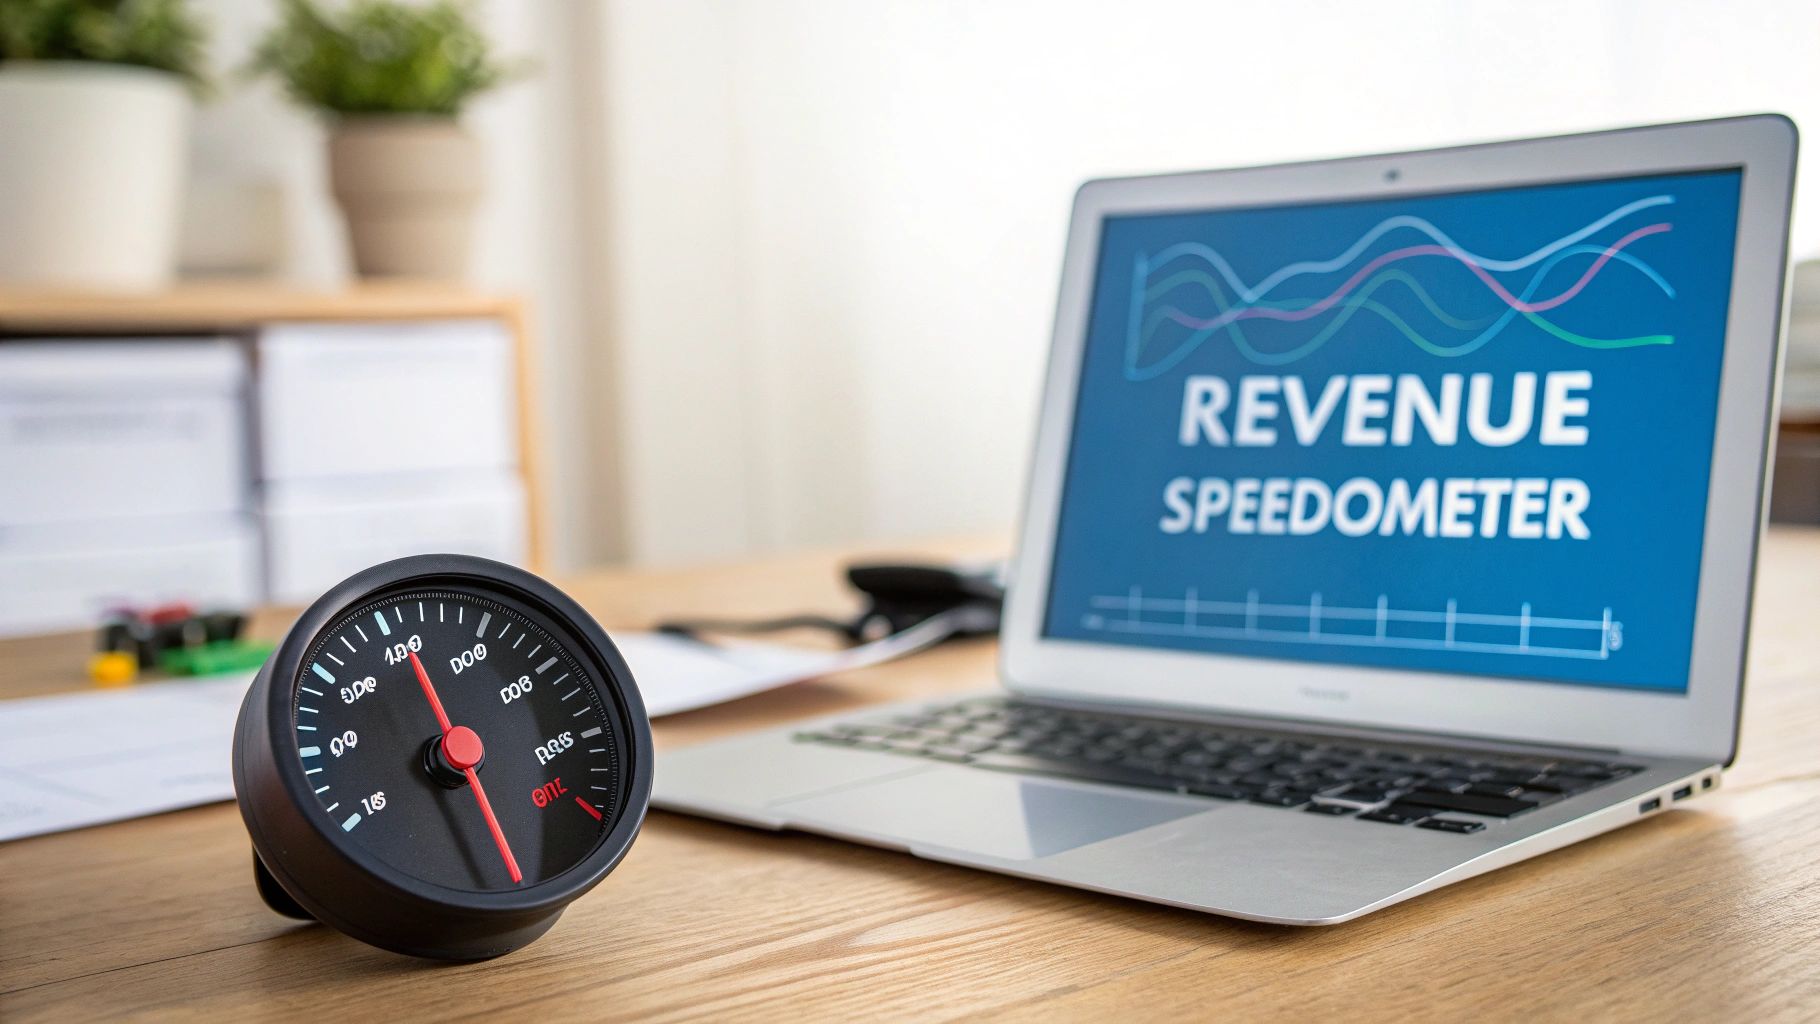
Trying to grow a B2B company without tracking sales velocity is like trying to drive a race car blindfolded. You might be moving, but you have no idea how fast, in what direction, or if you're about to hit a wall. Sales velocity gives you that dashboard.
Instead of getting lost in a dozen different KPIs, this single metric bundles four critical sales elements into one powerful number. It stops you from just looking in the rearview mirror at last quarter's results and shows you what's really happening in your pipeline right now.
The Sales Velocity Formula
The calculation itself is surprisingly straightforward, bringing together the four key drivers of your sales motion. Once you get your head around this equation, you can see exactly which part of your process is firing on all cylinders—and which part is holding you back.
Sales Velocity = (Number of Opportunities × Average Deal Size × Win Rate) / Sales Cycle Length
This isn't just some business school theory. It's the go-to metric for sales leaders at the sharpest SaaS and professional services firms. For instance, a solid mid-market team with 50 opportunities, a $2,500 average deal, a 35% win rate, and a 28-day sales cycle has a velocity of $1,562.50 per day. You can see how top leaders apply this formula over at Sales Assembly.
Each piece of that formula is a lever you can pull. Nudge one up, and your revenue speed increases. It’s an incredibly powerful tool for forecasting and strategic planning.
Breaking Down The Four Levers
To really get what sales velocity is all about, you have to understand its four building blocks. Each one tells you something different about the health of your pipeline. Improve any single one, and your velocity—and your revenue—goes up.
Here’s a quick-reference guide to what each of these levers actually means.
The Four Components of the Sales Velocity Formula
| Component | What It Measures | Impact on Velocity |
|---|---|---|
| Opportunities (#) | The number of qualified leads in your pipeline over a set period. | Increases Velocity: More quality at-bats at the top of the funnel give you more chances to score. |
| Average Deal Size ($) | The average dollar value of a closed-won deal. | Increases Velocity: Bigger deals mean every single win brings in more cash. |
| Win Rate (%) | The percentage of opportunities that actually become paying customers. | Increases Velocity: A higher closing rate shows your team is getting more effective. |
| Sales Cycle Length (Days) | The average time it takes to get from first contact to a signed contract. | Decreases Velocity: A shorter sales cycle is what you want here. The faster you close, the faster you get paid. |
Each of these components is a vital sign for your business. By tracking them together, you move from guesswork to a predictable, scalable revenue machine.
Why Sales Velocity Is Your North Star Metric
Think about your sales dashboard for a second. You’re probably tracking win rate, average deal size, and maybe a dozen other things. They’re all useful, sure, but they only ever show you a small piece of the puzzle.
You might even be tricking yourself. Let’s say you crush your average deal size goal this quarter. High-fives all around, right? But what if it took you twice as long to close those deals? You’re working harder, not smarter, and your revenue might not have budged. This is where sales velocity flips the script.
It’s the one number that acts as a true health check for your entire B2B revenue engine. By rolling four key variables into a single, straightforward metric, sales velocity gives you a crystal-clear picture of your sales momentum. It's the North Star you can actually steer by.
When you track it, you stop looking in the rearview mirror at lagging indicators (like last quarter's closed-won revenue) and start using powerful leading indicators. It’s the difference between reacting to what already happened and making smart, proactive moves to shape the future.
From Reactive to Predictable Revenue
Too many sales teams are stuck in a reactive loop. They hit quota, they miss quota, but they can't quite articulate why. They celebrate a monster deal but have no clue how to land another one just like it. A bad month comes along and everyone scrambles, pointing fingers without knowing where the process actually broke down.
Shifting your focus to sales velocity changes that entire dynamic. It forces you to see your sales motion for what it is: a complete system, where every part affects the others.
A sudden drop in velocity, for instance, isn't just a "bad month." It's a diagnostic signal. Did lead quality take a nosedive? Has a new competitor entered the chat and started slowing down decisions? Are your reps hitting a wall with a certain type of prospect?
This metric isn't just data—it's clarity. It’s the key to building a predictable revenue machine. You stop hoping for good results and start engineering them by pulling the four levers that actually matter. It’s a systemic approach, and it’s the only way to build scalable growth.
A good CRM dashboard will show you this at a glance, plotting your sales velocity over time so you can spot trends instantly.
This kind of visualization tells you immediately if your pipeline is healthy and if your strategies are actually working. No more guesswork.
Uncovering Hidden Bottlenecks
Here’s the real magic: sales velocity shines a spotlight on the hidden bottlenecks that individual KPIs almost always miss. Your win rate could be rock-solid, but if your sales cycle is slowly getting longer month after month, your velocity is tanking—and your revenue is in jeopardy.
Think about these all-too-common scenarios:
- High Opportunity Volume, Low Velocity: Marketing is flooding the pipeline with leads, but they’re not qualified. Your reps are buried in busywork, the pipeline gets clogged, and the whole system grinds to a halt. (If this sounds familiar, check out our guide on B2B demand generation strategies).
- Strong Win Rate, Slow Cycle: Your team are killer closers, but deals take forever to get over the line. The bottleneck could be anything from a clunky contracting process to a simple lack of urgency in the sales conversation.
- Large Deal Size, Low Win Rate: You’re spending all your time hunting whales but only landing one or two. You might actually make more money—and have a much healthier velocity—by focusing on smaller, faster wins.
This isn’t just theory. For Growlancer clients targeting execs at startups and scale-ups, this metric is everything. Our Targeted Outreach Engine finds 800 perfect-fit prospects every single month, and with 15-30% conversion rates, we absolutely slash the time it takes to get that first meeting, often in just 14-21 days. Want to see how other top teams are building playbooks to ramp up their velocity? The team at Sales Assembly has some great insights.
Alright, let's get into the nuts and bolts. Knowing the theory is nice, but the real magic happens when you calculate sales velocity with your own numbers.
This isn't some abstract academic exercise. It’s about digging into your CRM, pulling a few key figures, and seeing exactly how fast your revenue engine is running. Let's walk through how to do it with two completely different business models to show you how it works in the real world.
Step 1: Find Your Four Core Metrics
First things first, you need to pull four specific data points from your CRM, whether that’s HubSpot, Salesforce, or something else. To keep things consistent and useful, I always recommend looking at the last 90 days. It's a sweet spot—long enough to smooth out weird spikes, but recent enough to be relevant.
Here’s what you’re looking for:
- Number of Opportunities (#): This is the total count of new, qualified deals that landed in your pipeline during that 90-day window. In HubSpot, you can usually find this in your deals report by filtering for "Create Date."
- Average Deal Size ($): Simple enough. What’s the average dollar value of a "Closed-Won" deal? Your sales performance dashboard should spit this number right out for you.
- Win Rate (%): What percentage of deals that reached a final decision (won or lost) did you actually win? Just divide your "Closed-Won" deals by the total number of closed deals (won + lost) in that period.
- Sales Cycle Length (Days): On average, how long does it take to close a deal? This is the average time between when a deal is created and when it’s marked "Closed-Won."
Got those four numbers? Good. Now for the fun part.
Example 1: The High-Volume SaaS Business
Let's imagine a B2B SaaS company, we’ll call them "ScaleUp Software." They sell a project management tool, and their whole game is about high volume—lots of leads, quick conversions.
They dug into their CRM for the last 90 days and found this:
- Number of Opportunities: 250
- Average Deal Size: $5,000 (annual contract)
- Win Rate: 20% (or 0.20)
- Sales Cycle Length: 30 days
Now, we plug it into the formula:
(250 Opportunities × $5,000 Deal Size × 0.20 Win Rate) / 30-Day Sales Cycle = $8,333 per day
So, what does this mean? ScaleUp Software is generating $8,333 in pipeline value every single day. That’s their speedometer. Now they can stop guessing and start modeling. What happens if they can bump their win rate to 25%? Instantly, their velocity jumps to over $10,400 a day. That's a real, tangible goal.
Example 2: The High-Value Professional Services Firm
Now, let's look at "Apex Advisory," a consulting firm. They play a totally different game—fewer deals, but massive contract values with enterprise clients. Their sales process is naturally longer and built on deep relationships.
Here's their 90-day snapshot:
- Number of Opportunities: 20
- Average Deal Size: $150,000
- Win Rate: 30% (or 0.30)
- Sales Cycle Length: 120 days
Let's run their numbers:
(20 Opportunities × $150,000 Deal Size × 0.30 Win Rate) / 120-Day Sales Cycle = $7,500 per day
The takeaway? Even with way fewer deals and a sales cycle four times as long, Apex Advisory is still humming along at $7,500 per day. For them, the biggest lever isn't necessarily getting more leads; it's speed. Shaving just 10 days off that sales cycle would boost their daily velocity by over $600.
As you can see, this simple formula tells a powerful story. It's not just a vanity metric. If you have 100 opportunities at a $20,000 average value, a 25% conversion rate, and a 60-day cycle, your daily revenue is $833. As highlighted in Plecto's analysis of sales performance, this is exactly how fast-growing companies get frighteningly accurate at predicting revenue.
Make this calculation a regular habit, and you’ll finally move from hoping for revenue to building a predictable growth machine.
The Four Levers to Systematically Increase Revenue Speed
Knowing the sales velocity formula is a good start. But using it to deliberately engineer revenue growth? That’s where the real magic happens.
Think of the formula less like a static report and more like a control panel with four big levers. Each one—Opportunities, Win Rate, Deal Size, and Sales Cycle—can be pulled to directly crank up your revenue speed.
Focusing on just one of these variables can make a huge difference. Getting all four to work together? That’s how you build a powerful, predictable growth engine.
Let's break down how you can actually pull each lever and get your business moving faster. This diagram shows how the data from your CRM flows into the calculation, giving you the insights you need to act.
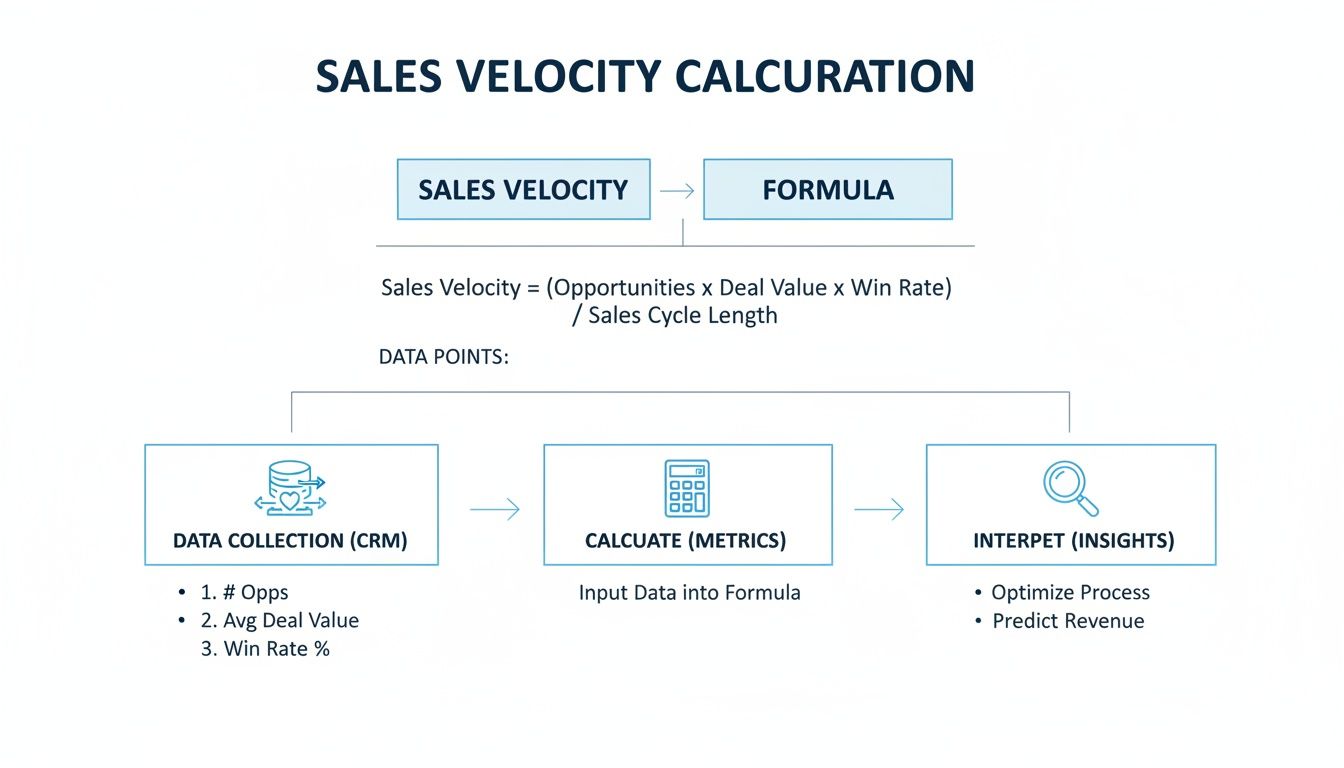
The process is simple but incredibly powerful: grab the four data points, run the numbers, and use the result to sharpen your strategy.
Lever 1: Boost Your Number of Opportunities
This is the most obvious lever. More shots on goal, right? More qualified opportunities at the top of your funnel should mean more revenue at the bottom.
But the key word here is qualified. Jamming your pipeline full of junk leads will just clog the system and slow everything down. The goal is to fill the funnel with prospects who are a perfect fit for your Ideal Customer Profile (ICP).
- Implement Authority-Led Content: Generic marketing doesn't work for B2B, especially when you're selling to the C-suite. They don't want fluff; they want expertise. We help our clients at Growlancer position their leadership as the go-to experts on platforms like LinkedIn. This turns their personal profiles into magnets for high-intent, inbound leads.
- Deploy Targeted Outreach: Don’t just sit back and wait. Proactively identify and connect with the exact companies you want to work with. A systematic outreach engine can fill your team's calendar with hundreds of ideal buyers every month, creating a steady stream of valuable conversations.
- Refine Your Lead Qualification Process: Get marketing and sales in a room and don’t let them leave until they agree on what a "qualified" lead actually is. A tight process ensures reps aren't wasting time and are only focused on deals that have a real shot at closing. For a deeper look at this, check out our guide on how to qualify sales leads.
Lever 2: Elevate Your Win Rate
Getting more at-bats is one thing, but you also need to get better at hitting the ball.
Even a small bump in your win rate—say, from 20% to 25%—can have a massive impact on your velocity. This lever is all about making your sales team more effective. A higher win rate is proof that your message is landing, your team is executing, and you're consistently beating the competition.
Focusing on win rate transforms your sales team from order-takers into strategic consultants. It forces you to analyze every stage of the buyer's journey, identify where deals are stalling, and arm your reps with the tools they need to build unstoppable momentum.
To start improving your win rate, zoom in on these areas:
- Sales Coaching and Training: Your team needs reps. Constantly train them on product knowledge, handling objections, and how to position against competitors. Role-playing and call reviews are your best friends here.
- Optimize Your Sales Process: Map out your sales stages and find the bottlenecks. Are deals getting stuck waiting for a proposal? Is the legal review a black hole? Smoothing out these internal snags removes friction and helps reps close.
- Use Social Proof and Case Studies: Give your sales team the ammunition they need. Arm them with powerful case studies, testimonials, and hard data that proves your value. This builds trust and gives buyers the confidence to choose you.
Lever 3: Grow Your Average Deal Size
The third lever is simple: sell bigger deals.
When each sale is worth more, every single win contributes more to your bottom line. You can boost your velocity without even needing more customers.
This isn’t about luck; it's about strategy.
- Master Upselling and Cross-selling: Look for opportunities to sell premium packages or add-on services. It's almost always easier to sell more to a happy customer than it is to find a brand new one.
- Introduce Tiered Pricing: Structure your pricing to guide customers toward higher-value plans. Show them exactly why the more expensive option delivers a much bigger ROI.
- Focus on High-Value ICPs: If you sell to different types of customers, figure out which segment consistently writes the biggest checks. Then, point all your marketing and sales firepower in that direction.
Lever 4: Shorten Your Sales Cycle
This is the one lever you want to push down, not up. The faster you can move a qualified lead from "hello" to a signed contract, the higher your sales velocity.
A shorter sales cycle means cash in the bank sooner, and your reps can move on to the next deal. It's pure efficiency.
According to research from Richardson Sales Performance, top teams close deals 27% faster because they equip their reps with better tools and training. For scale-ups selling to executives—where a founder's authority is what opens doors—a tight sales cycle is absolutely critical for forecasting revenue.
Here’s how to start compressing your timeline:
- Create a Sense of Urgency: Use a time-sensitive offer or clearly demonstrate the cost of not acting. Give buyers a compelling reason to make a decision now, not next quarter.
- Remove Friction: Make it ridiculously easy for people to give you money. Use e-signature tools, simplify your contracts, and have a seamless onboarding process locked and loaded.
- Align with the Buyer's Process: Don't get surprised by their procurement process. Understand their internal steps for approval upfront so you can anticipate their needs and prevent last-minute delays.
Each of these four levers offers a direct path to increasing how fast you generate revenue. Pulling them in a coordinated way is how you build a truly scalable sales machine.
Here’s a quick-glance table breaking down how to approach each one.
Strategic Levers to Accelerate Sales Velocity
| Lever | Primary Goal | Example Tactic (Growlancer Method) | Impact on Velocity |
|---|---|---|---|
| # of Opportunities | Increase the volume of qualified leads entering the pipeline. | Build executive authority on LinkedIn to attract high-intent buyers. | Directly increases the number of potential deals in any given period. |
| Win Rate (%) | Improve the percentage of opportunities that become closed-won deals. | Equip reps with targeted case studies and data to overcome objections. | Boosts the efficiency of the entire sales process, making every opp more valuable. |
| Average Deal Size ($) | Increase the average revenue generated from each closed-won deal. | Create premium pricing tiers and focus sales efforts on high-value ICPs. | Multiplies the value of each win, increasing overall revenue without more customers. |
| Sales Cycle (Days) | Decrease the time it takes to move a lead from contact to contract. | Proactively align with the buyer's internal approval process to avoid delays. | Speeds up cash flow and allows reps to close more deals in the same timeframe. |
By systematically improving each of these four metrics—getting more ideal customers into your funnel, closing them more effectively, at a higher price point, and in less time—you create a compounding effect that accelerates your entire business.
Benchmarking Your Sales Velocity Against the Market

So, you've crunched the numbers and have your sales velocity figure. The next question is always the same: "Is this any good?"
Honestly? There's no magic number. A "good" sales velocity is completely relative to your business.
What works for a high-volume SaaS company selling small monthly subscriptions would be a disaster for a consultancy chasing massive enterprise deals. Your industry, business model, and the customers you sell to all dictate what a healthy number looks like.
The real goal isn't to hit some arbitrary industry average. It's to figure out your baseline and then find ways to systematically push that number higher.
Industry and Sales Model Variations
Your market sets the pace. You have to understand the game you're playing before you can set a realistic benchmark for your team.
- Transactional Sales (think SMB SaaS): This is all about speed. Price points are lower, buying decisions are simple, and sales cycles are measured in days. Here, you live and die by a high number of opportunities and a lightning-fast close, even if the average deal size is modest.
- Enterprise Sales (think Complex Software or Pro Services): This is a completely different beast. Sales cycles can easily blow past 90 days while you navigate layers of stakeholders, procurement red tape, and security reviews. The average deal size is huge, so your velocity depends more on a solid win rate and big contract values than on pure speed.
For enterprise sellers, even tiny tweaks to the sales cycle can create massive wins. If your average cycle is 90 days, shaving off just 20% of that time can practically double your sales velocity. In a tough market, that's a game-changer.
Economic Shifts and Performance
Your sales velocity doesn't operate in a bubble. The wider economy can throw a wrench in your entire sales motion practically overnight. When things get tight, you see more hesitation, frozen budgets, and a whole lot more scrutiny on ROI.
This pushes sales cycles out and shrinks deal sizes. It's not just you—it's happening everywhere.
In 2023, for instance, a staggering 81% of companies saw their velocity take a hit as buyers got more risk-averse. GTM studies showed that this hesitation poisoned sales cycles, forcing smart leaders to get ruthless about segmenting their pipelines and focusing only on the deals with the highest probability of closing. If you want to dig into the data, you can explore more insights on sales velocity from Plecto.
This is where adaptability comes in. The best teams don't just stick to the old playbook. They pivot. They might shift focus to products with a quicker, more obvious ROI. Or they might double down on their existing customer base to drive expansion revenue, which almost always comes with a shorter, friendlier sales cycle.
By keeping an eye on these outside pressures, you can see the story behind your numbers and make the right strategic calls to stay ahead.
Building Your High-Velocity Sales System
Alright, we’ve covered the full blueprint. You get what sales velocity is—it's the speedometer for your revenue. You also see why it's probably the most important predictive metric you can track for B2B growth. And you know the four levers you can pull to crank it up.
So, the conversation shifts. We're moving past understanding the formula and into actually building a system that makes it work.
Real growth isn't about yanking one lever and crossing your fingers. It's about building a machine where every piece of the velocity equation is constantly being tuned up. This means creating a predictable engine that brings in great opportunities, gives your team what they need to win, and pushes deals through the pipeline with purpose.
Your Action Plan for Predictable Growth
A high-velocity sales system means getting strategic with each of those four core metrics. It's about making deliberate choices that directly affect how you fill your funnel, talk to prospects, and close deals. A solid system blends marketing and sales, making sure every single activity is designed to speed up revenue.
For example, solid sales pipeline management is the bedrock. It’s what lets you accurately track your velocity and spot the bottlenecks before they completely wreck your quarter. If you're flying blind without a clear view of your deals, you're just guessing.
Your goal is to stop reacting to what’s in your pipeline and start actively engineering it. A high-velocity system isn't something you set up once and walk away from; it's a commitment to a data-driven process where you're always improving, and every decision is measured by its impact on the speed of revenue.
The first step? Diagnose your current sales velocity. Go pull the numbers from your CRM and get that baseline. From there, find your weakest lever and pour your energy into fixing it. Building a predictable, high-speed revenue engine starts with one focused action.
Frequently Asked Questions About Sales Velocity
Alright, you get the formula. You see the potential. But knowing the theory and actually weaving this metric into your day-to-day operations are two different things.
This is where the rubber meets the road. Let's tackle the questions that pop up the moment you try to move sales velocity from a spreadsheet into the real world.
How Often Should I Calculate Sales Velocity?
The honest answer? It depends on how fast your deals close.
If you’re running a transactional sales process with a 15-day cycle, you'll want to check this weekly. You'll spot trends and hiccups almost in real-time. But if you're in the enterprise world with a 120-day sales cycle, looking at it weekly will just give you noise. Monthly or even quarterly will be far more telling.
For most B2B companies, a monthly calculation is the sweet spot. It’s frequent enough to catch problems before they sink your quarter, but not so frequent that you’re overreacting to every little blip.
The real key here is consistency. Pick a cadence—monthly is a great start—and stick with it. That’s how you build a reliable baseline to measure yourself against.
Can Sales Velocity Be Too High?
You bet it can. Chasing speed at all costs is a recipe for disaster. Think of it like a car redlining—sure, you're going fast, but you're about to blow the engine.
An unnaturally high sales velocity is a massive red flag. It often means your team is just grabbing the low-hanging fruit and ignoring the bigger, better opportunities. This leads to some ugly downstream problems:
- Sky-High Churn: You rush deals through, signing up poor-fit customers who bail after a few months. This kills your LTV and torches your reputation.
- Shrinking Deal Sizes: Reps start dodging the more complex, high-value deals because they take longer. They're sacrificing long-term revenue for a short-term speed boost.
- Burnt-Out Reps: A relentless “close it now” culture creates a pressure-cooker environment that will burn out your A-players.
The goal isn't just speed. It's healthy, sustainable momentum.
What Is the First Step to Improving My Sales Velocity?
Stop trying to fix everything at once. You'll just spin your wheels.
The single best first step is to find your biggest bottleneck. It’s that simple.
Pull up your sales velocity formula and look at the four levers. Go back and compare them to last month, last quarter, last year. Where are you bleeding the most?
Pipeline packed but your win rate is in the gutter? Your qualification is broken. Winning deals but your average deal size is tanking? Your team is probably handing out discounts like candy.
Find the one variable that's dragging the whole formula down. Put all your energy there. That’s how you get the biggest bang for your buck, fast.
Ready to stop guessing and start building a predictable pipeline? Growlancer combines authority content and targeted outreach to systematically improve every component of your sales velocity. See how we can fill your calendar with qualified meetings at https://growlancer.ai.